Getting started
This is a hand-held first session. By the end you will have a brokerage account (an account in Tradr) and one position taken from draft to closed. You will also have read your own figures back. It takes about ten minutes, and every step tells you what you should see.
Tradr walks you through the same four steps inside the app. Choose Walk me through it on your first dashboard and the product guides you through them in order. This page is that same route, written down.
This guide describes the hosted app at app.tradr.cloud. If you run your own
instance, the screens are identical. The few differences are called out in
Self-hosted notes.
Before you start
Section titled “Before you start”You need:
- An email address and a browser. Use the latest Chrome, Firefox, Safari, or Edge.
- Nothing else. Tradr works as a plain manual journal. This tutorial needs no broker connection, no API keys, and no payment.
Step 1 — Register
Section titled “Step 1 — Register”- Open https://app.tradr.cloud.
- Choose Register.
- Enter your email and a password, then confirm the password.
- Choose Register again.
Expected result: you land on a setup screen headed Welcome to Tradr. It is not an empty dashboard. Below it sits a Get set up checklist of four items.
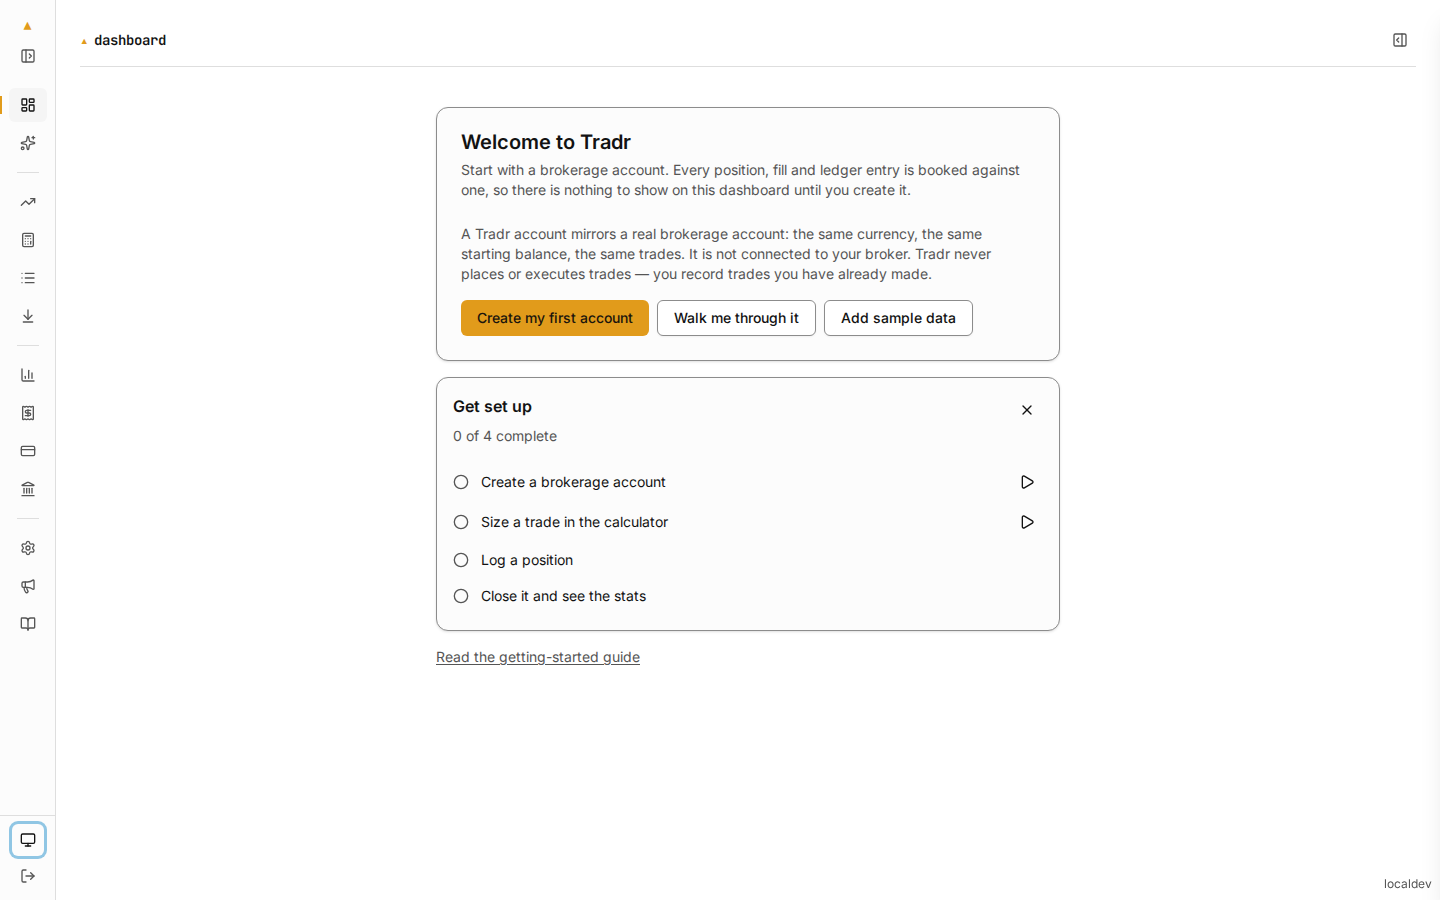
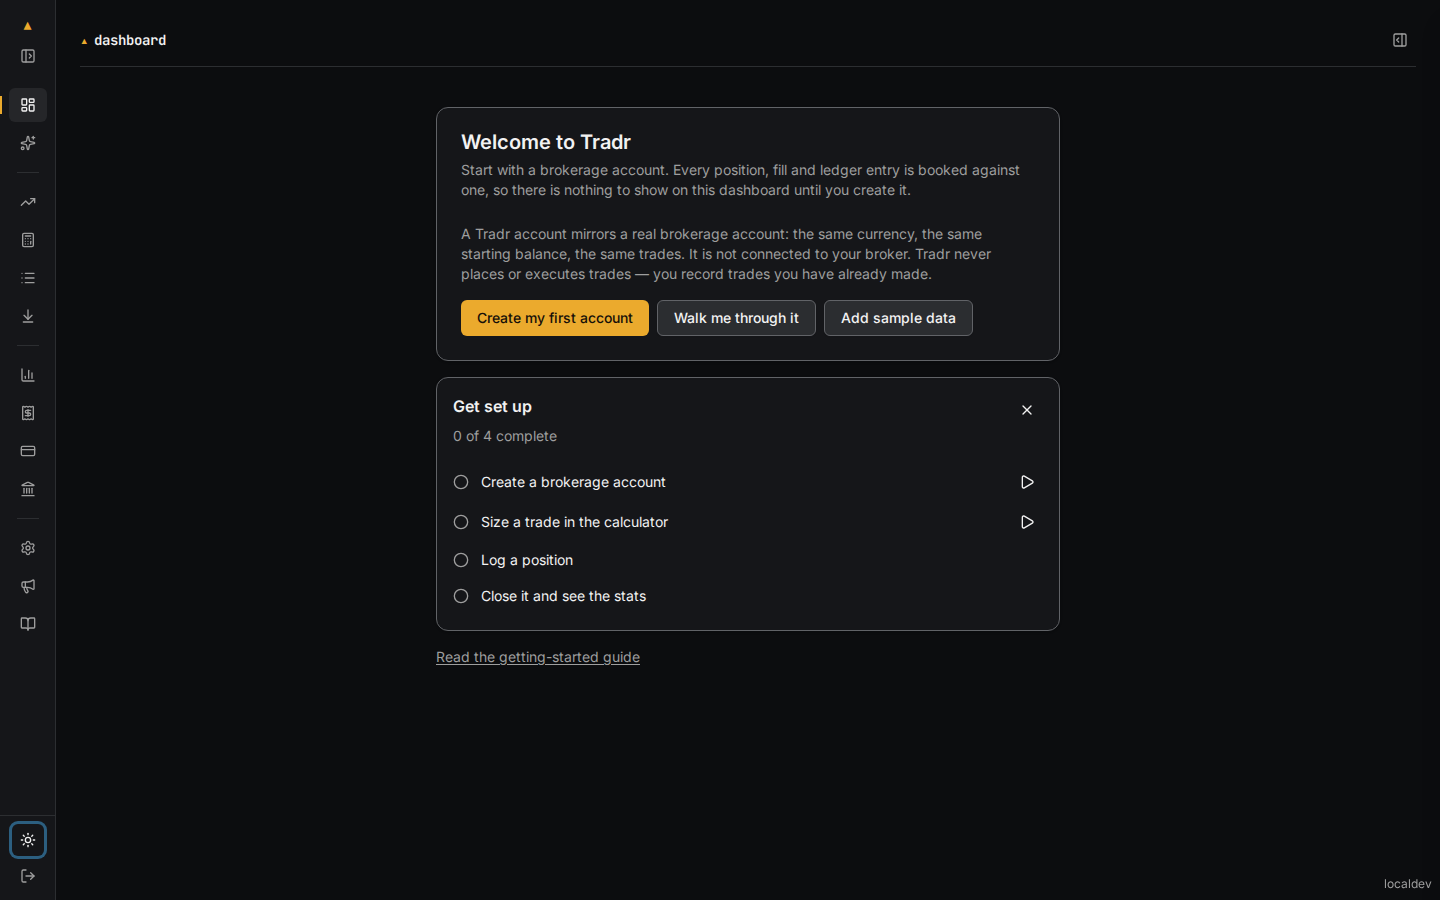
The welcome card offers three ways forward:
- Create my first account — the path this guide follows.
- Walk me through it — the same four steps, guided inside the app.
- Add sample data — a ready-made account to look around in.
Step 2 — Create a brokerage account
Section titled “Step 2 — Create a brokerage account”Every position, fill and ledger entry is booked against an account. Nothing else in Tradr works until one exists.
A Tradr account mirrors a real brokerage account: the same currency, the same starting balance, the same trades. It is not connected to your broker. Tradr never places or executes trades. You record trades you have already made.
- Choose Create my first account.
- Fill in the form described below.
- Choose Create.
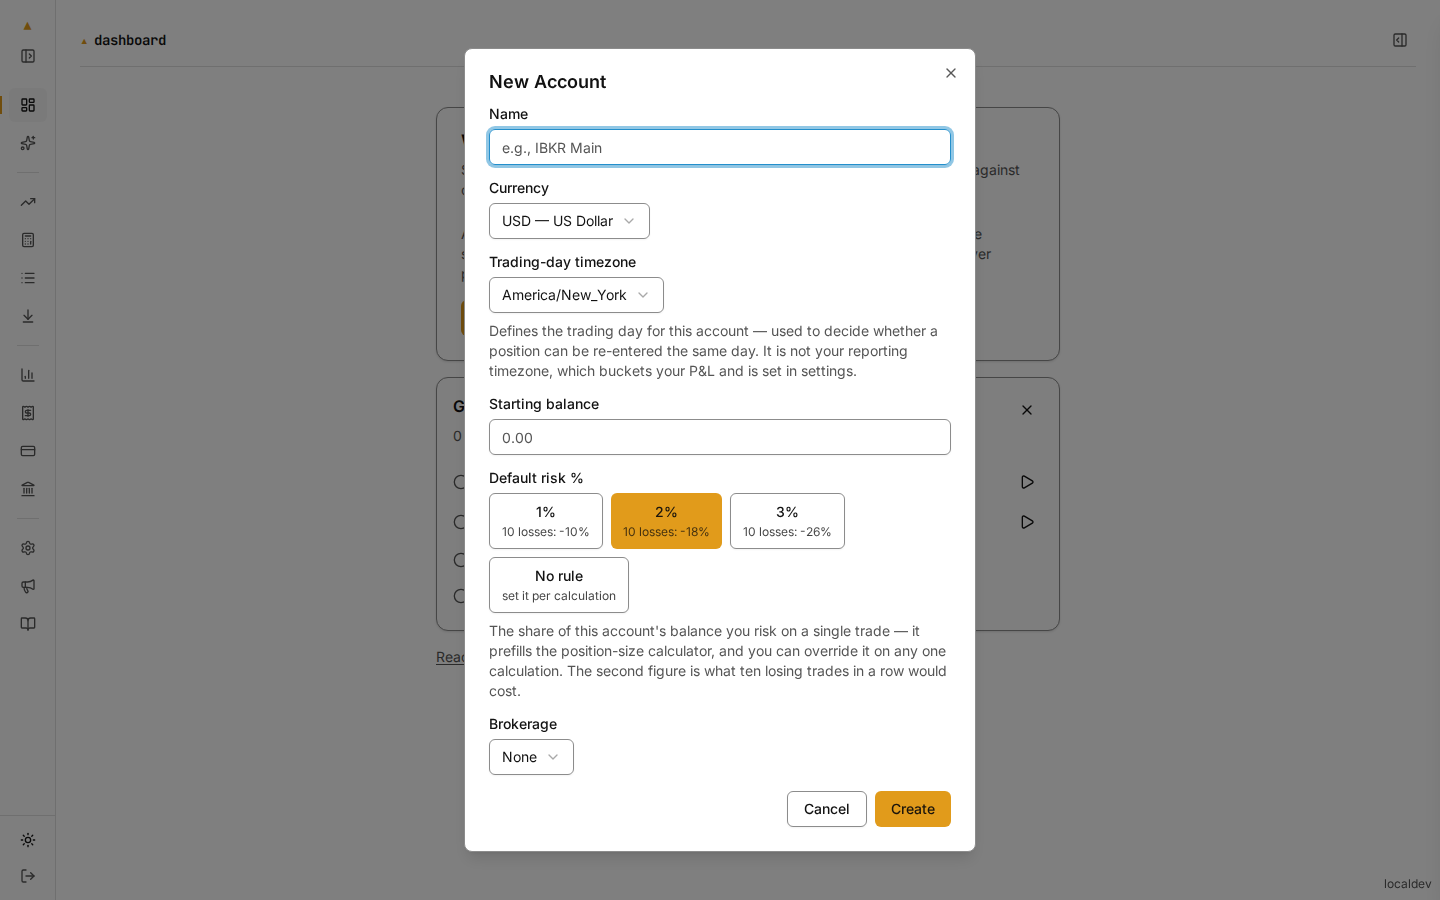
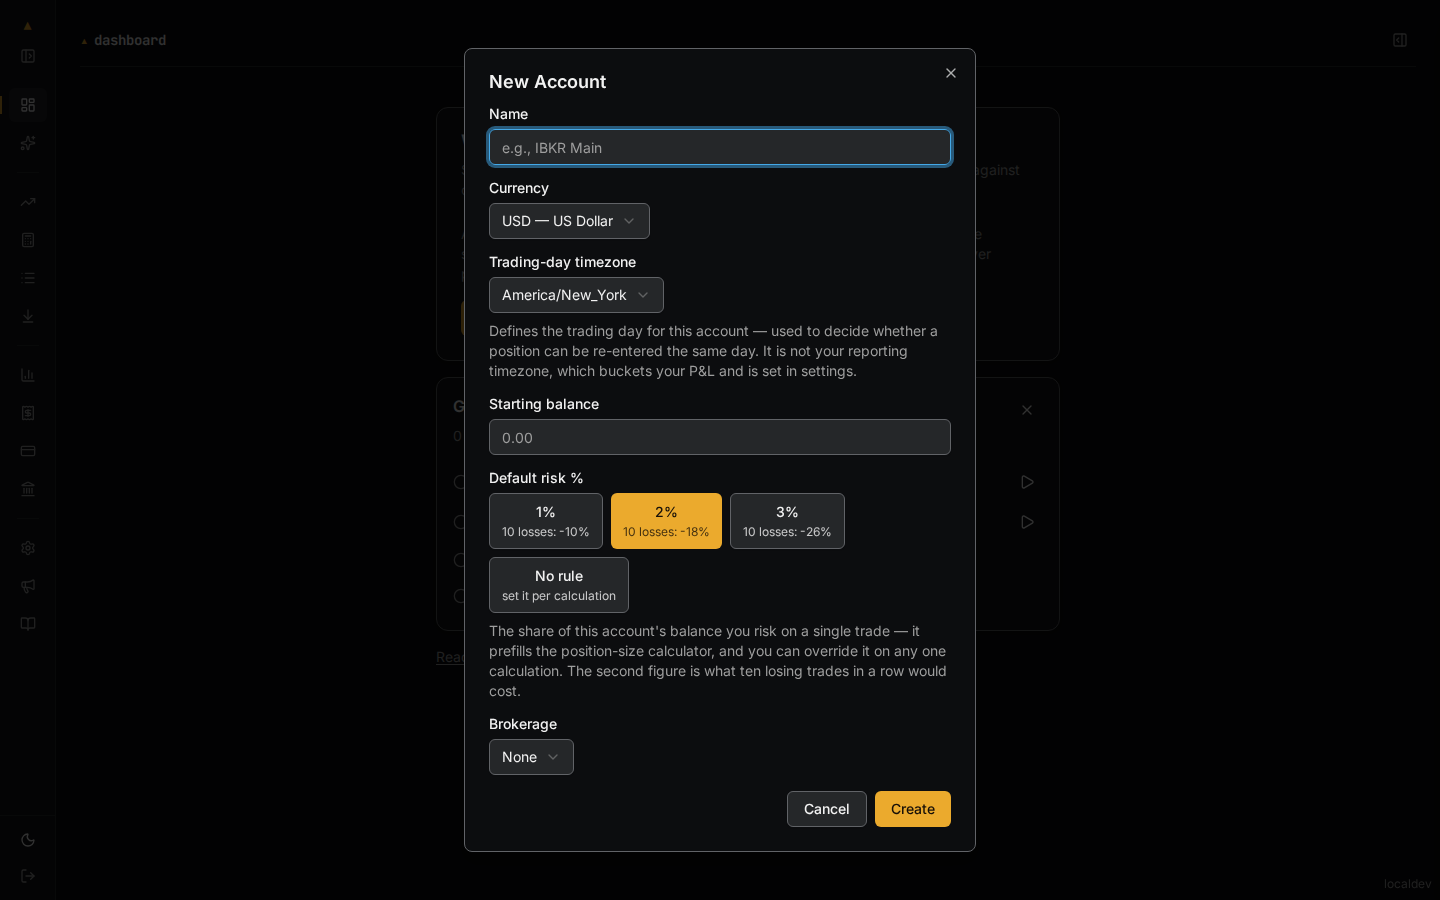
The form has six fields, in this order.
Name. Name the account after the brokerage account it mirrors. You pick it by this name every time you log a position.
Currency. The currency this account trades in. Its balance, fees and P&L are all recorded and shown in this currency.
Trading-day timezone. This defaults to America/New_York because NYSE,
NASDAQ and NYSE Arca all operate on US Eastern. It defines the trading day for
this account. That is what decides whether a position can be re-entered the same
day. It is not your reporting timezone — see the next
section.
Starting balance. The account’s opening cash, and the baseline every later figure is measured against. Set it once, here. The balance Tradr shows you is this figure plus every ledger entry. Editing it later would move every historical balance with it, so it cannot be changed once the account exists. Leave it empty and the account starts at zero.
Default risk %. The share of this account’s balance you risk on a single trade. It prefills the trade calculator, and you can override it on any one calculation without changing the account. Pick 1%, 2% or 3% — each one shows what ten losing trades in a row would cost, and 2% is chosen for you. No rule sets none, and leaves the calculator’s risk percent empty. Unlike the starting balance, you can change this whenever you want.
Brokerage. Choose a brokerage and Tradr records this account’s fees from that brokerage’s fee schedule. Leaving it on None is valid. You then enter fees yourself on each fill, and you can attach a brokerage later.
Expected result: your dashboard replaces the welcome screen. The first checklist item ticks itself.
Open Accounts to see what you made. The list shows Name, Currency, and an unlabelled last column holding a ⋯ menu with Edit and Delete in it. Balances are not in this list. They appear in the dashboard’s Account Balances widget.
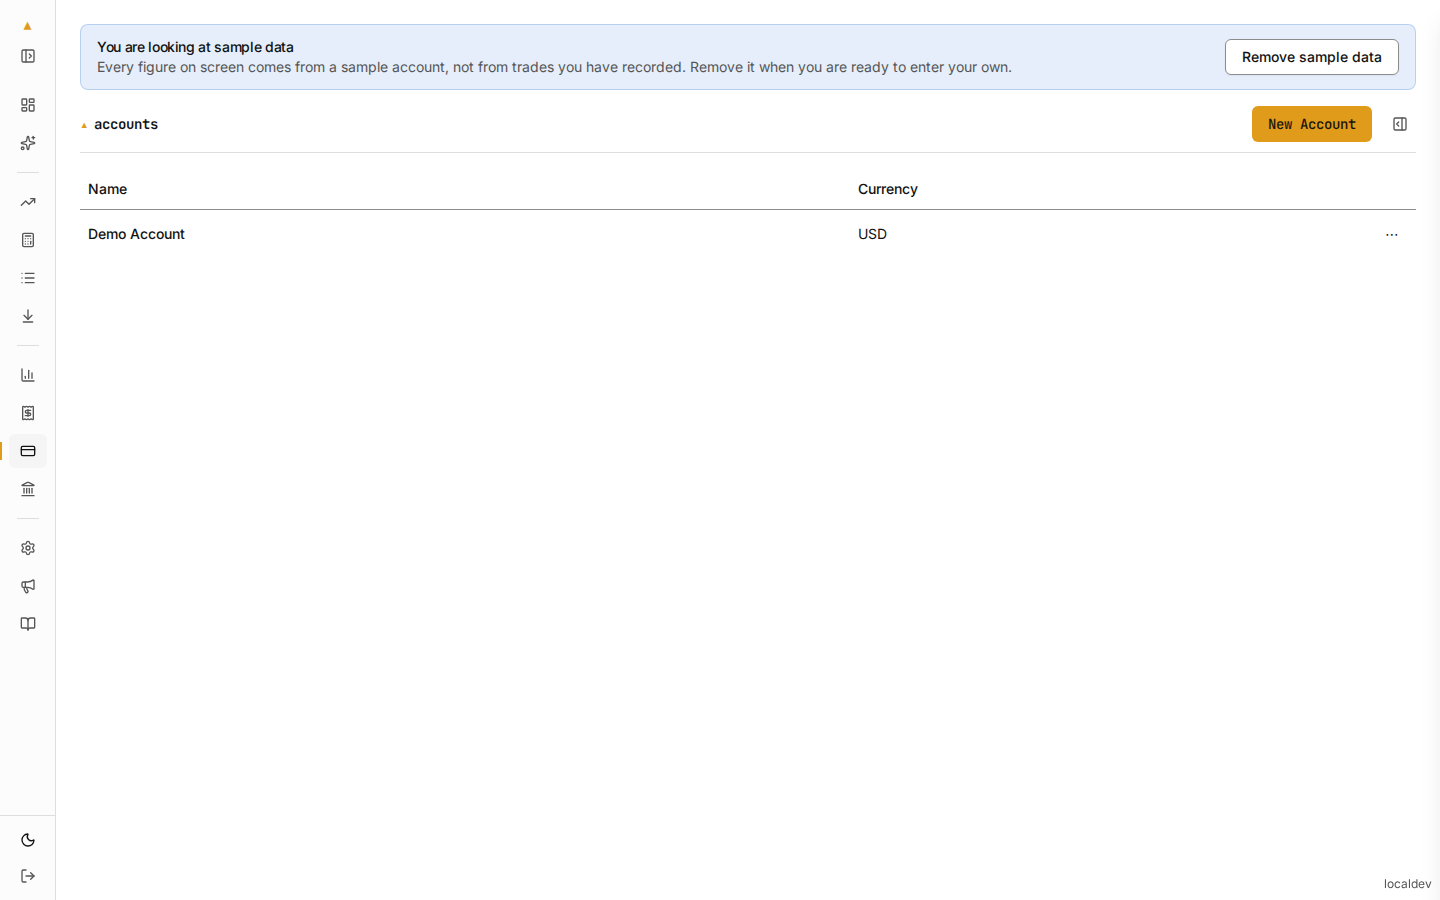
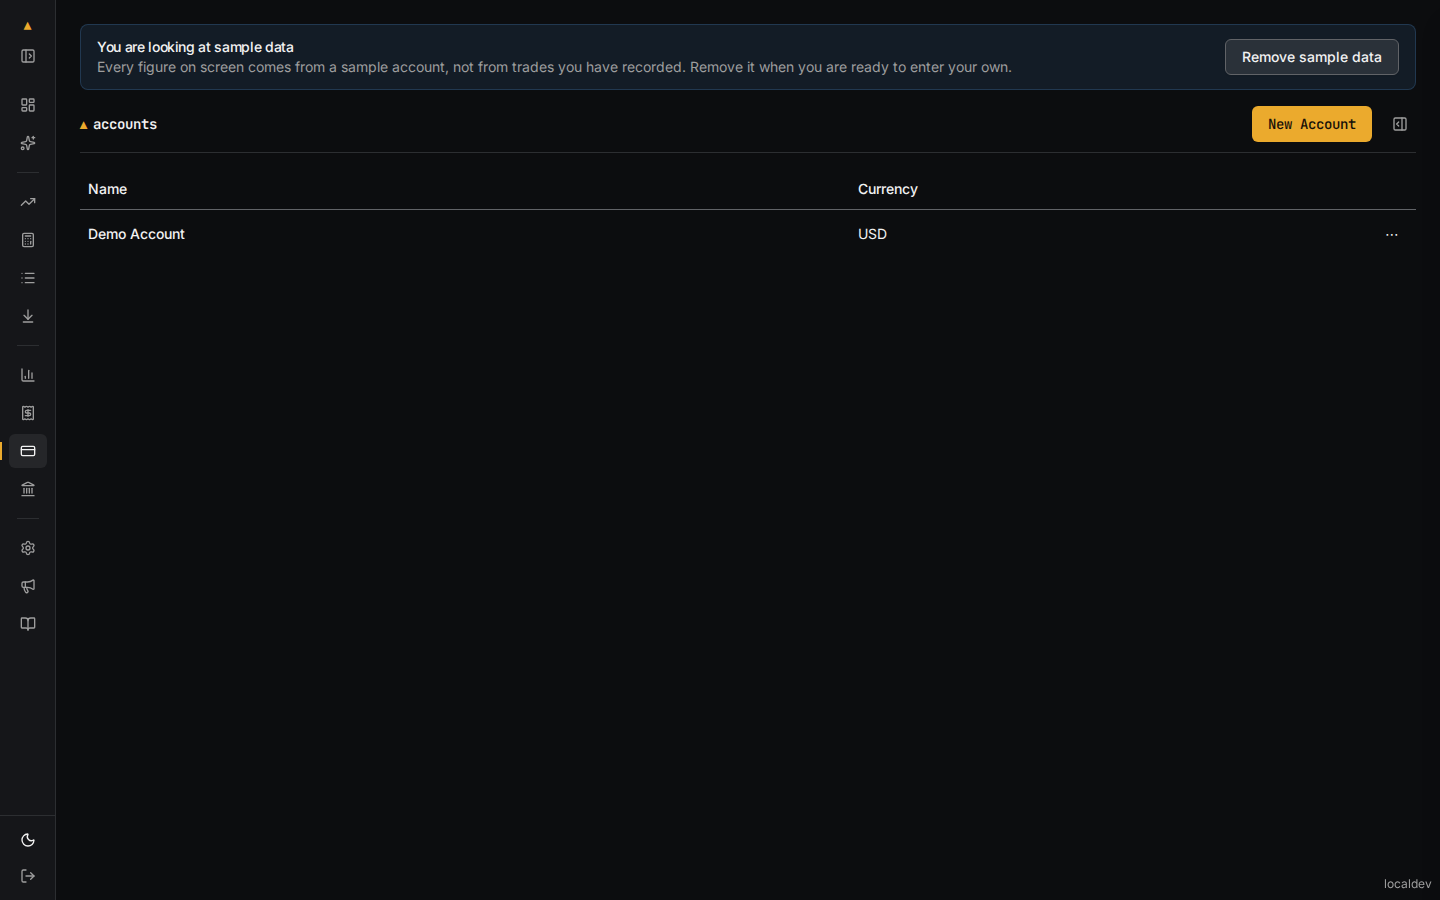
The figure above carries the sample account rather than one of your own, so the sample-data banner sits above it.
Tradr supports multiple accounts in different currencies and consolidates them into a single view. One account is enough for this tutorial. See Accounts & the multi-currency ledger when you are ready to add more.
Your reporting timezone is a separate setting
Section titled “Your reporting timezone is a separate setting”Separately from the account, Tradr stores one reporting timezone for you. It is the zone your P&L is bucketed into by day, week and month. It follows you, so those figures stay the same wherever you open Tradr.
Tradr stored one from your browser when you registered. Confirm or correct it under Settings → Profile.
Setting one zone never sets the other. Changing your reporting timezone leaves every account’s trading-day timezone untouched. Changing an account’s leaves your reporting timezone untouched.
| Trading-day timezone | Reporting timezone | |
|---|---|---|
| Belongs to | One account | You |
| Set under | The account form | Settings → Profile |
| Decides | Whether a position can be re-entered the same day | How your P&L is bucketed by day, week and month |
| Starts as | America/New_York |
The zone your browser reported at registration |
Prefer to look around first?
Section titled “Prefer to look around first?”Choose Add sample data on the welcome screen. Tradr creates one sample account with a fixed set of positions in it. A banner then marks every figure on screen as sample data.
Sample data and your own accounts cannot both exist. Choose Remove sample data in the banner when you are ready to enter your own. No checklist item completes on sample data alone.
Step 3 — Size a trade in the calculator
Section titled “Step 3 — Size a trade in the calculator”Open Calculator. There is nothing to submit, the results recompute as you type, and no trade is created. Neither your entries nor the figures they produce are stored.
Tradr records one fact here, the first time a calculation succeeds: a timestamp. That is how the Get set up checklist can tell this step is done. Nothing about the calculation itself is kept.
- Enter the Entry price.
- Enter the Stop loss. The distance from entry to stop is your per-unit risk.
- Enter a Target price (optional) if you have one.
- Under Risk, choose Dollar or Percent. Dollar is the default.
- Choose the Account you are trading.
- Set the amount you are willing to lose.
Direction starts on Long and Mode on Stock, so a long stock trade needs neither. Symbol changes no figure. With a quote provider configured, a symbol unlocks Pull last price, which fills the entry price for you.
Under Percent, Risk percent prefills from that account’s Default risk % when it has one. Under Dollar, you type the Dollar risk yourself. Either way the figure applies to this calculation only. The account keeps its own rule.
The account does two more things. It supplies the currency the results are shown in. It also caps the position at the buying power the account has.
Expected result: a Position Sizing card gives you the Position size, the Per-unit risk, the Actual dollar risk, and the Total position value. With a target, a Risk / Reward card adds the Per-unit reward and the Risk/Reward ratio.
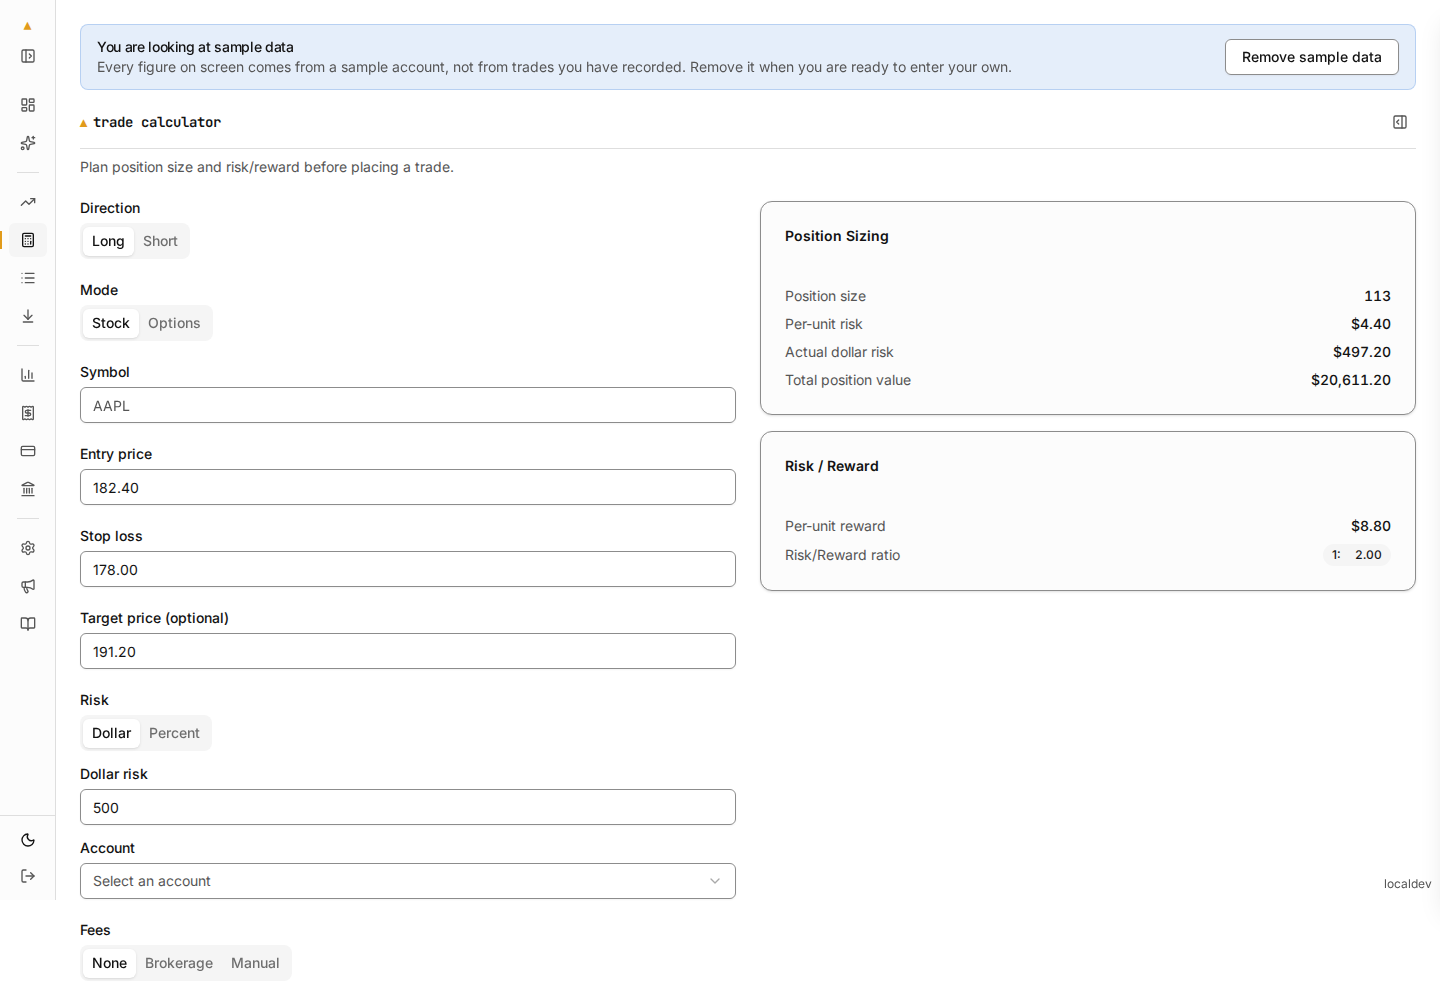
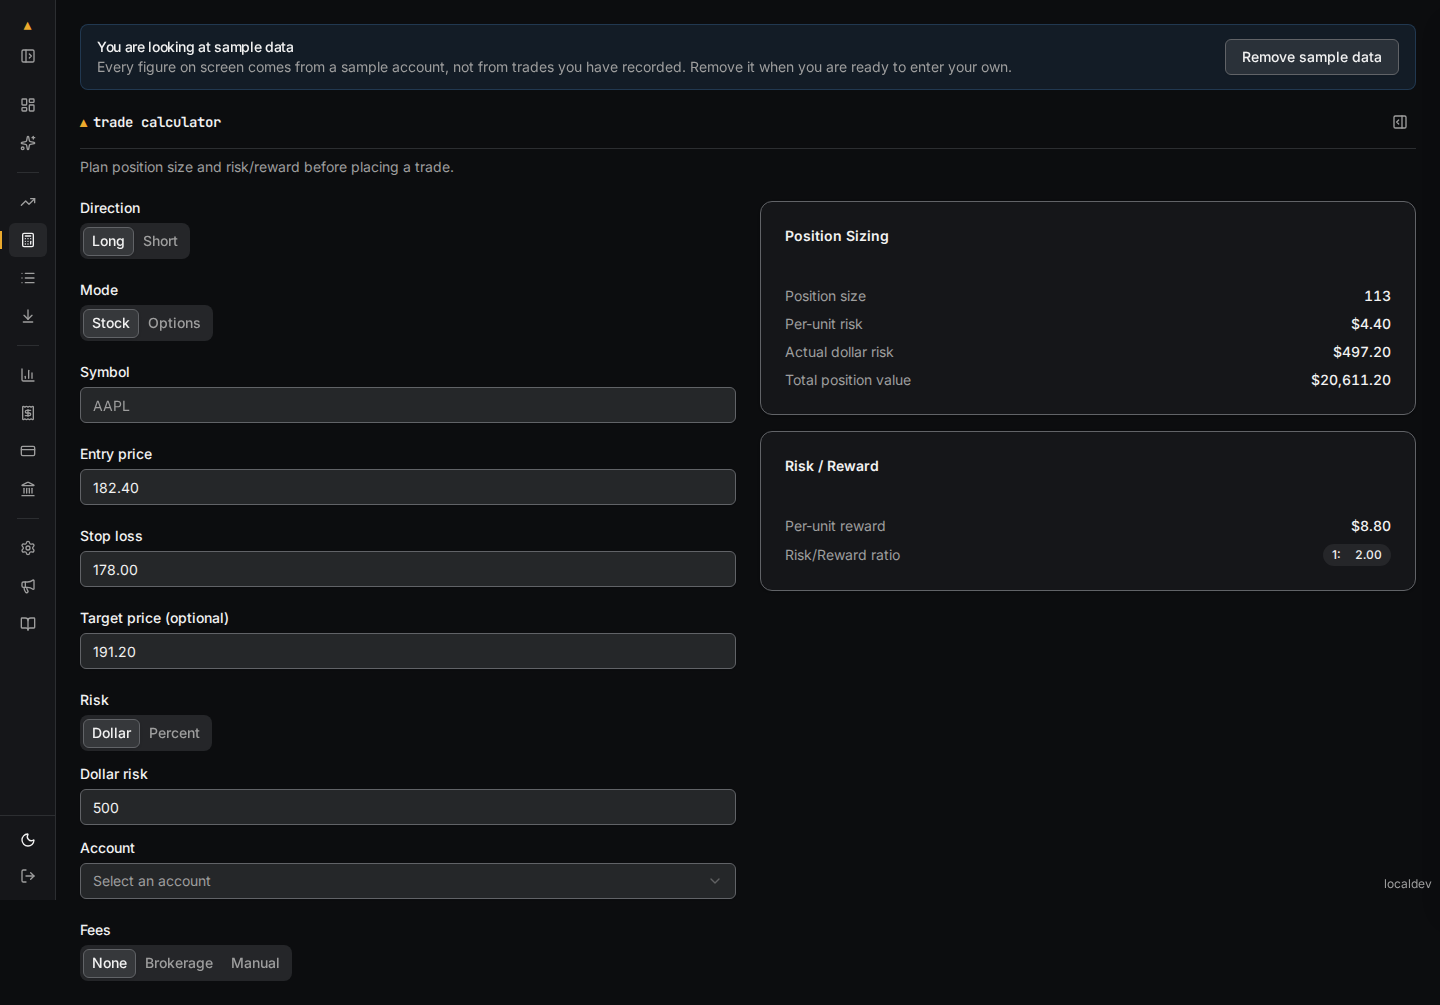
The figure above risks $500 at the prices the worked AAPL trade below uses. Entry 182.40 against a stop at 178.00 is $4.40 of risk per share, which buys 113 shares worth $20,611.20. The target at 191.20 pays $8.80 a share, a reward of twice the risk.
Position size is rounded down to whole units. That is why the actual dollar risk lands at or under your budget rather than on it. Here it is $497.20, not the $500 you asked for.
See Use the trade calculator for fee estimates and the options mode.
Step 4 — Log the position
Section titled “Step 4 — Log the position”A position in Tradr is one trade and every fill that belongs to it. It moves through three states.
| State | Meaning |
|---|---|
| Draft | A plan you have not entered. It posts nothing to your ledger and leaves your balance where it was. |
| Open | You are in the trade. Its cost is held against the account as position value. |
| Closed | You have exited in full. |
- Open Positions.
- Choose New Position.
- Enter the Symbol and choose the Side, the Asset Type, and the Account.
- Add Notes describing the setup. Why you took the trade is the part you will want back later.
- Choose Create.
That is the whole form for a stock. There is no quantity and no price here — both come from fills. Setting Asset Type to Option replaces Symbol with the contract’s underlying, expiry, type, and strike.
Expected result: the position is created as a draft. Your account balance is unchanged, because a draft is a plan rather than a trade.
Record the entry fill
Section titled “Record the entry fill”- Choose Add Fill.
- Leave Type on Entry.
- Enter the Price, the Quantity, any Fees, and the Date & Time.
- Choose Add.
Open the position
Section titled “Open the position”Choose Open Position.
The button stays disabled until an entry fill exists, and its tooltip then reads Add an entry fill first.
Expected result: the position is tagged open. Its cost is now held against the account as position value.
Step 5 — Close it and see the stats
Section titled “Step 5 — Close it and see the stats”- Choose Add Fill.
- Set Type to Exit.
- Enter the exit Price, the Quantity, any Fees, and the Date & Time.
- Choose Add.
Partial exits are ordinary. Add one fill per exit, and Tradr averages them for you.
Realized P&L does not wait for the close. Each exit fill posts its share to your account balance as it lands, which is the moment your balance moves.
When your exits balance the entered quantity, Tradr closes the position itself. Close Position stays disabled while any quantity is still open, with the tooltip Exit the full quantity first. The button covers the cases the automatic path does not.
Expected result: the position is tagged closed and carries its realized figures.
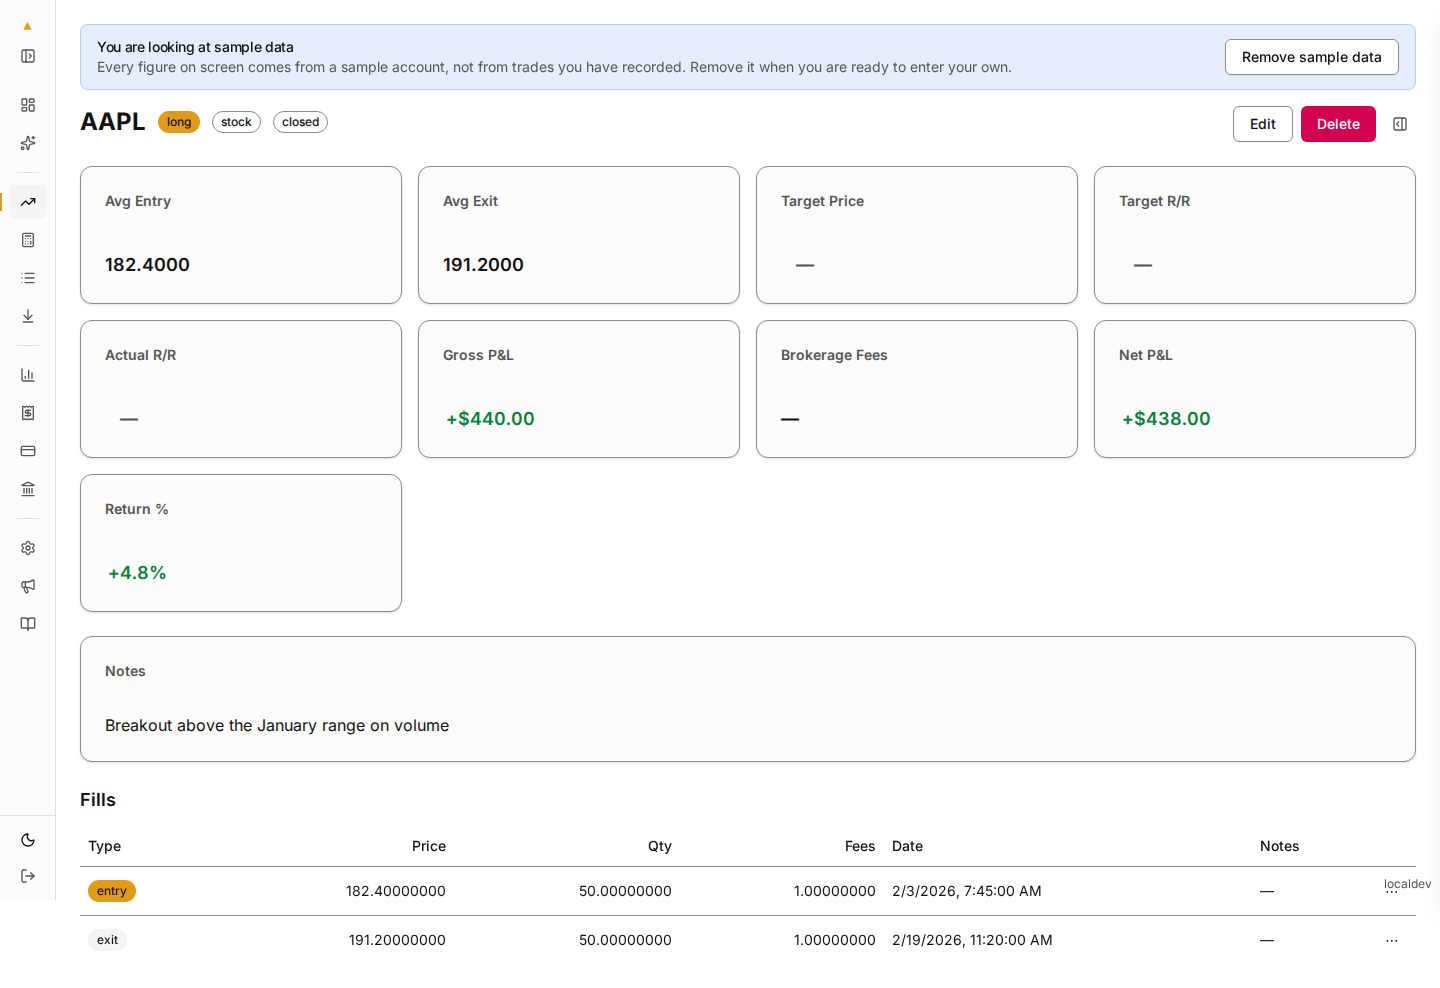
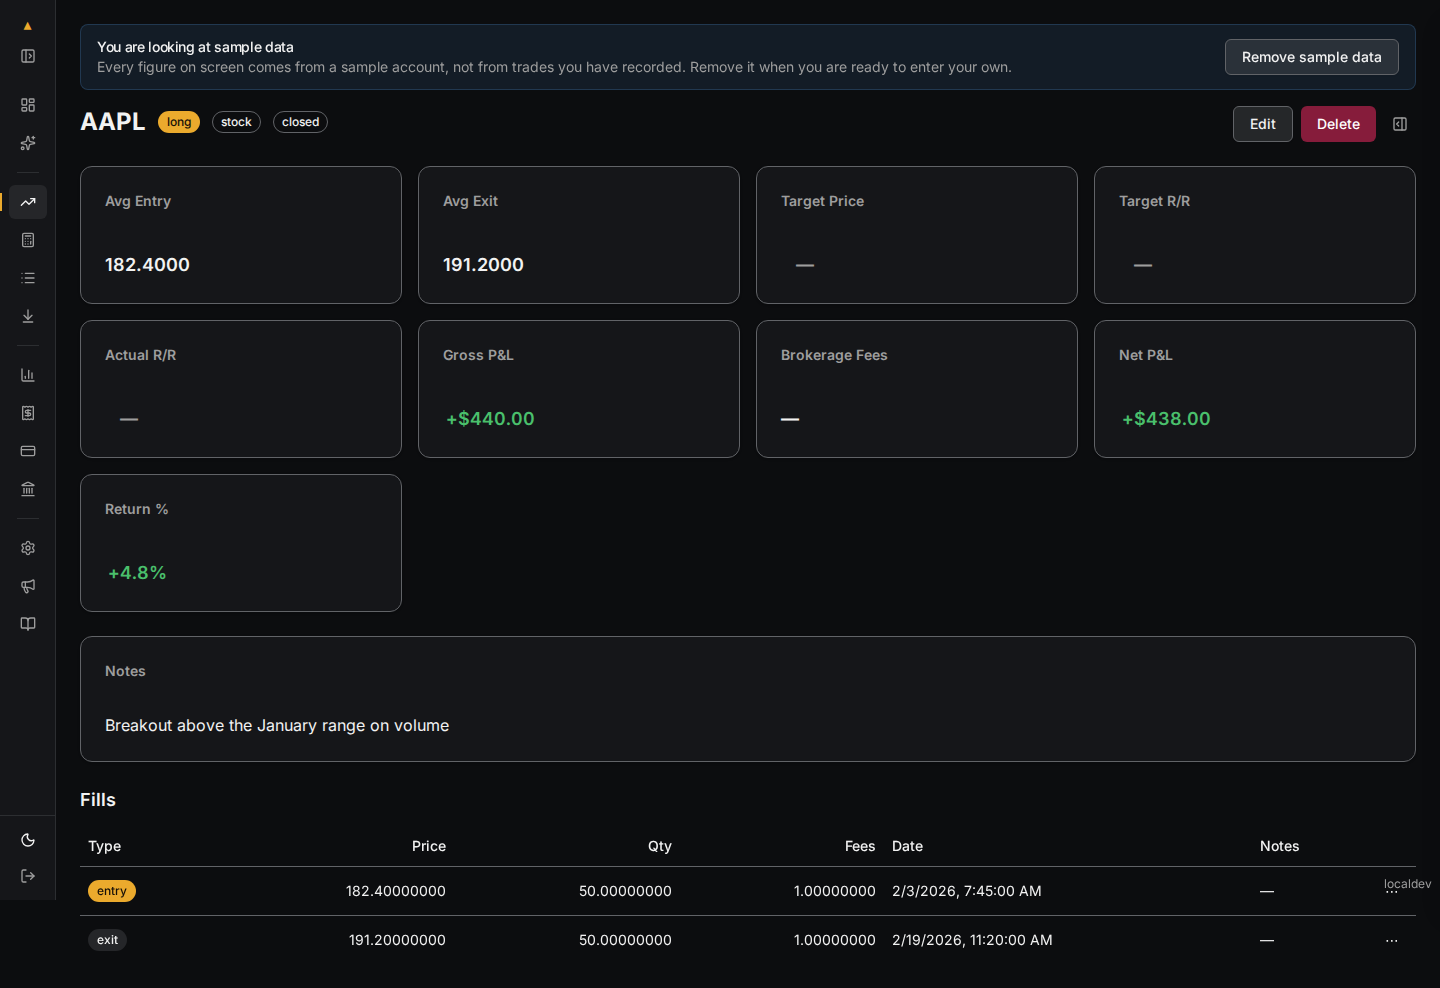
The figure above is the sample account’s closed AAPL position. It entered 50 shares at 182.40 and exited at 191.20, paying 1.00 in fees each side. Gross P&L is +$440.00, net P&L is +$438.00, and the return is +4.8%.
Positions also support scale-ins, partial exits, and reopening. See Log and manage positions for the full lifecycle, including deleting a draft you decide not to take.
Step 6 — Read your dashboard
Section titled “Step 6 — Read your dashboard”Go back to the Dashboard. The widgets now carry your own figures. Six ship by default: Stats Summary, Performance Chart, Equity Curve, Account Balances, Position Sizing, and Open Positions.
Expected result: all four checklist items are ticked. The checklist then retires and stops rendering.
The dashboard is a drag-and-drop widget grid. Use Add Widget to add a panel and Reset layout to start over. Your layout is saved to your account. See Customise the dashboard.
Step 7 — Review your performance
Section titled “Step 7 — Review your performance”- Open Performance.
- Choose a timeframe: Daily, Weekly, Monthly, Yearly, YTD, or All-Time.
Expected result: an equity curve for the window, a Statistics panel, and a breakdown table by period. With one closed position you get a single row. The picture fills in as you log more.
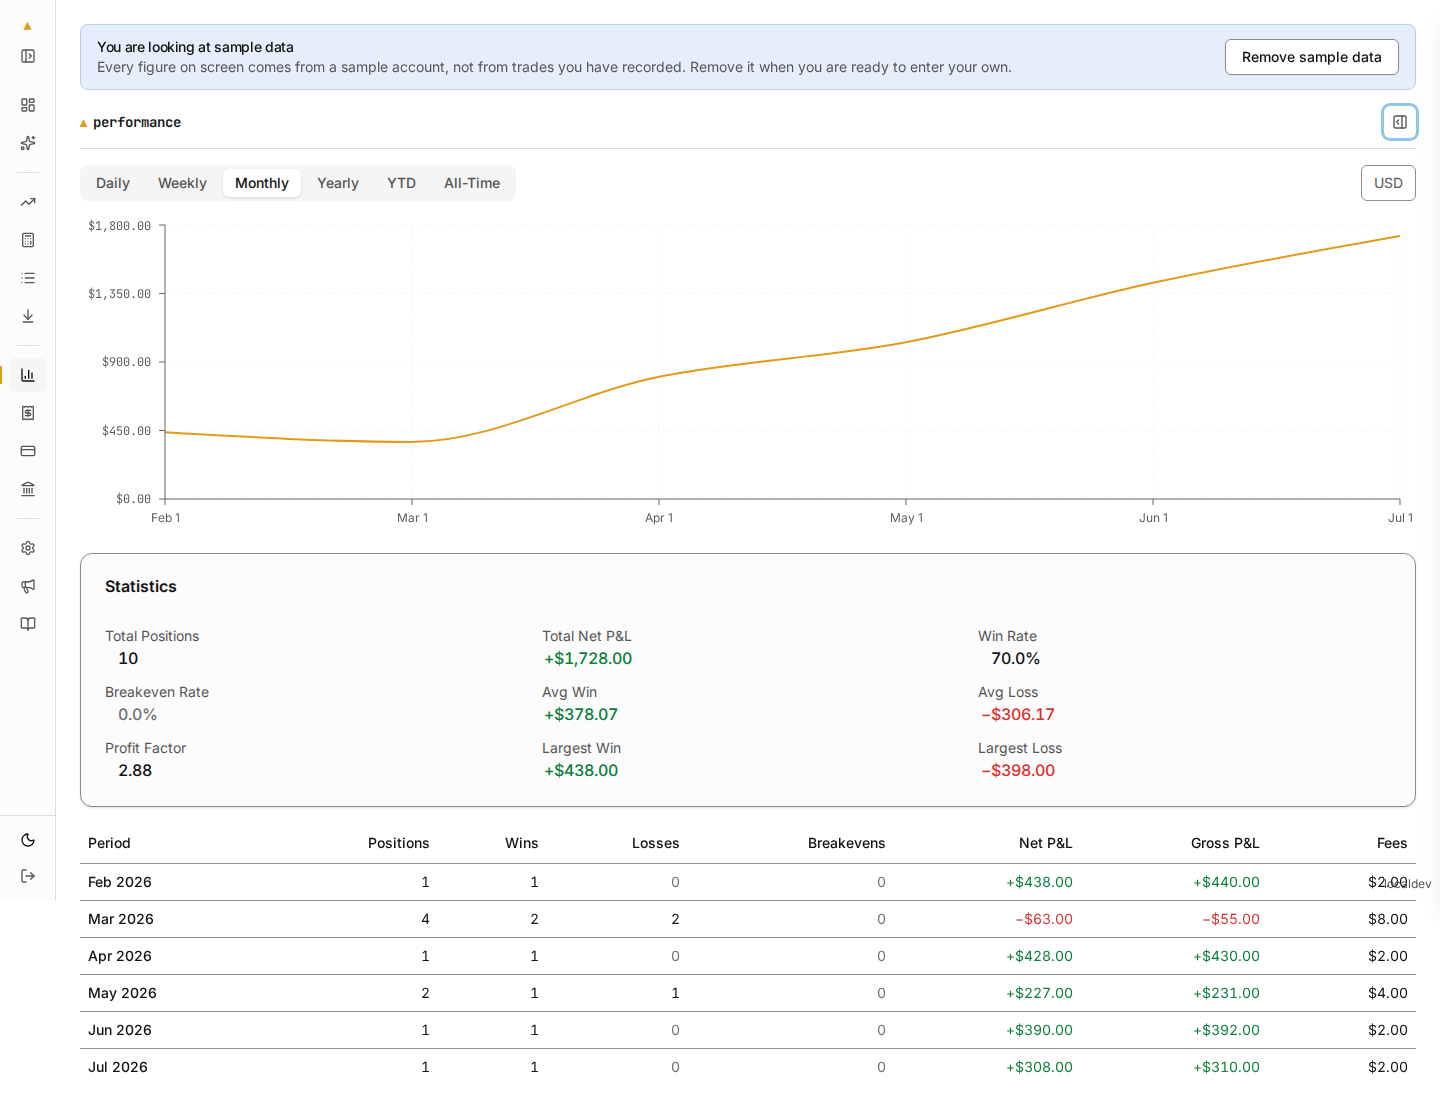
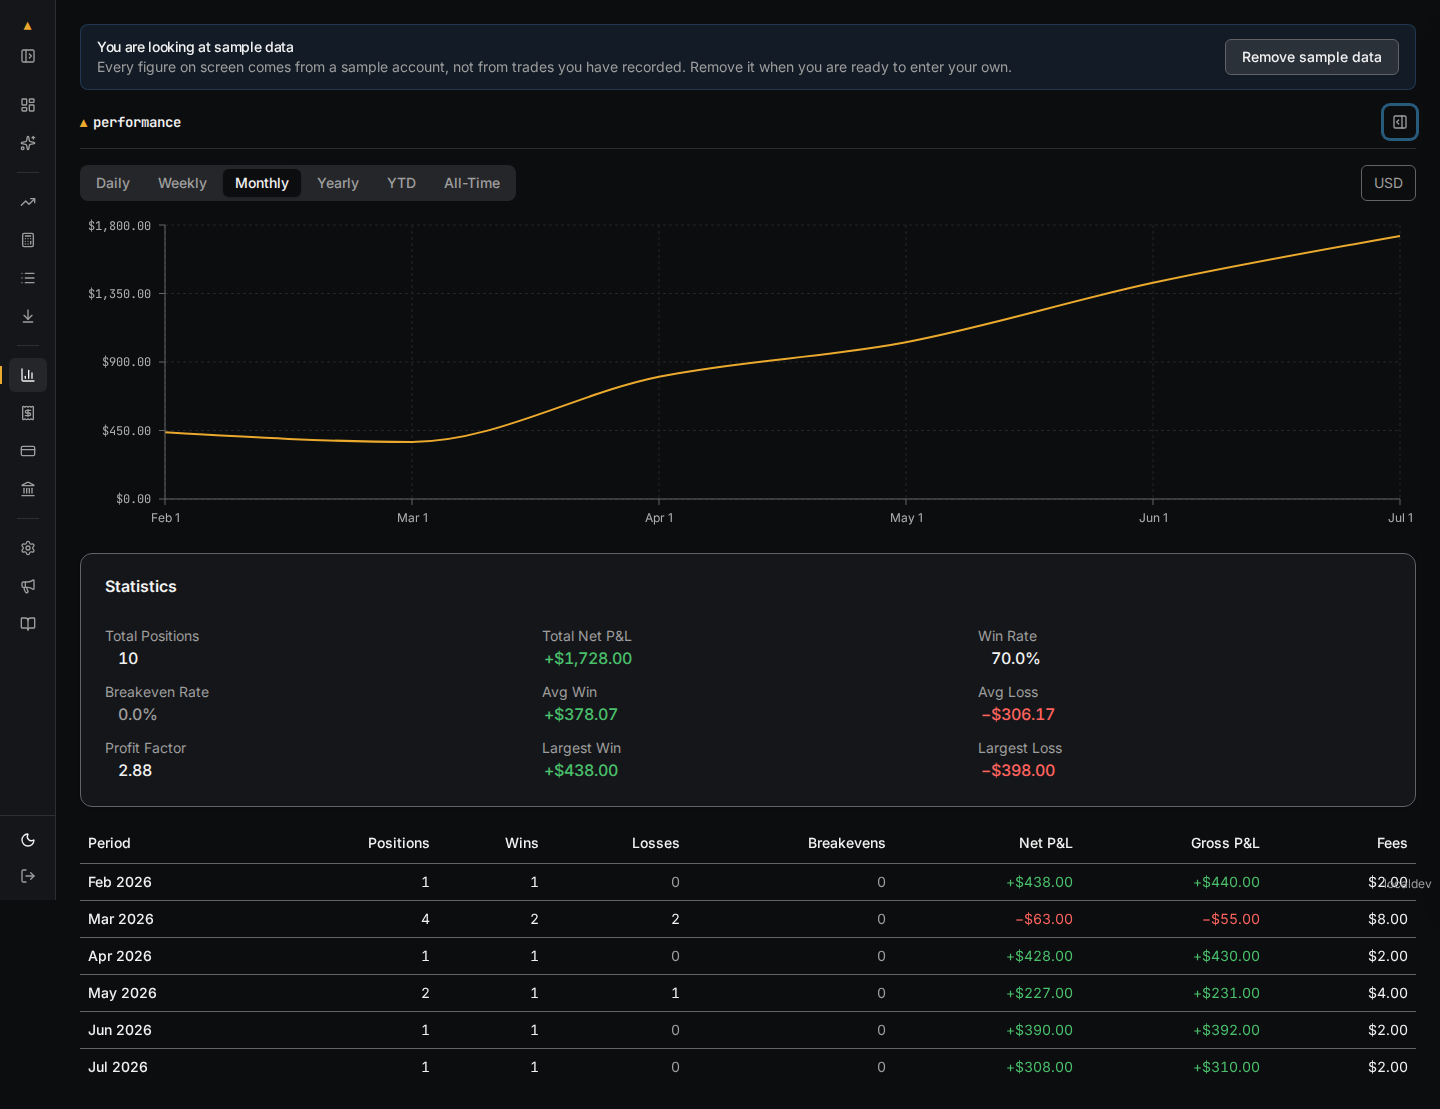
The figure above is the sample account across six months. It shows 10 closed positions, a total net P&L of +$1,728.00, and a win rate of 70.0%.
You’re done
Section titled “You’re done”You have completed a full loop: account → calculator → draft → open → closed → dashboard. From here, keep logging real positions. The value compounds as your history grows.
Next steps
Section titled “Next steps”- Log and manage positions — partial exits, scale-ins, reopening, and editing.
- Use the trade calculator — size and risk-check before you enter.
- Import trades from CSV — bring your history in from another journal or your broker.
- Accounts & the multi-currency ledger — add more brokers and currencies.
- Metrics glossary — exactly how each number is calculated.